
|
|
|
|
|
Hello everyone, I am here again to explain a trend in most relationships today. I have created a graph to represent how most of today's relationships occur. Let me start by posting the graph:
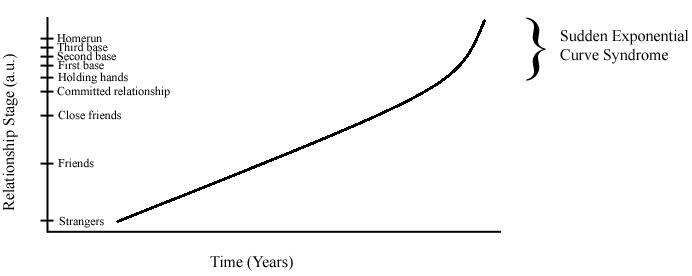
It is very obvious what the relationship stages are as well as the length between each stage. It is also noticeable that there is a sudden exponential growth as the relationship between two persons reach the committed relationship stage. The slope of the graph experiences something called "Sudden Exponential Curve Syndrome" (SECS) and this is very common in relationships today. However, this graph only projects the relationship status up until "homerun" and does not describe any later trends in the relationship. To look at what happens after the homerun stage, please check back later for my next note called: "The Relationship Cycle".
Disclamier - Please do not accept this note as a fact as this is for fun and laughs although slopes in graphs do experience SECS (Sudden Exponential Curve Syndrome). The terms first base, second base, third base and homerun are very arbitrary since these terms can mean multiple things. I do not state what each of those terms mean and they are for you to decide what they mean exactly. Tweet
Tweet